An End-to-end Software Pipeline to Simulate Exploding Stars
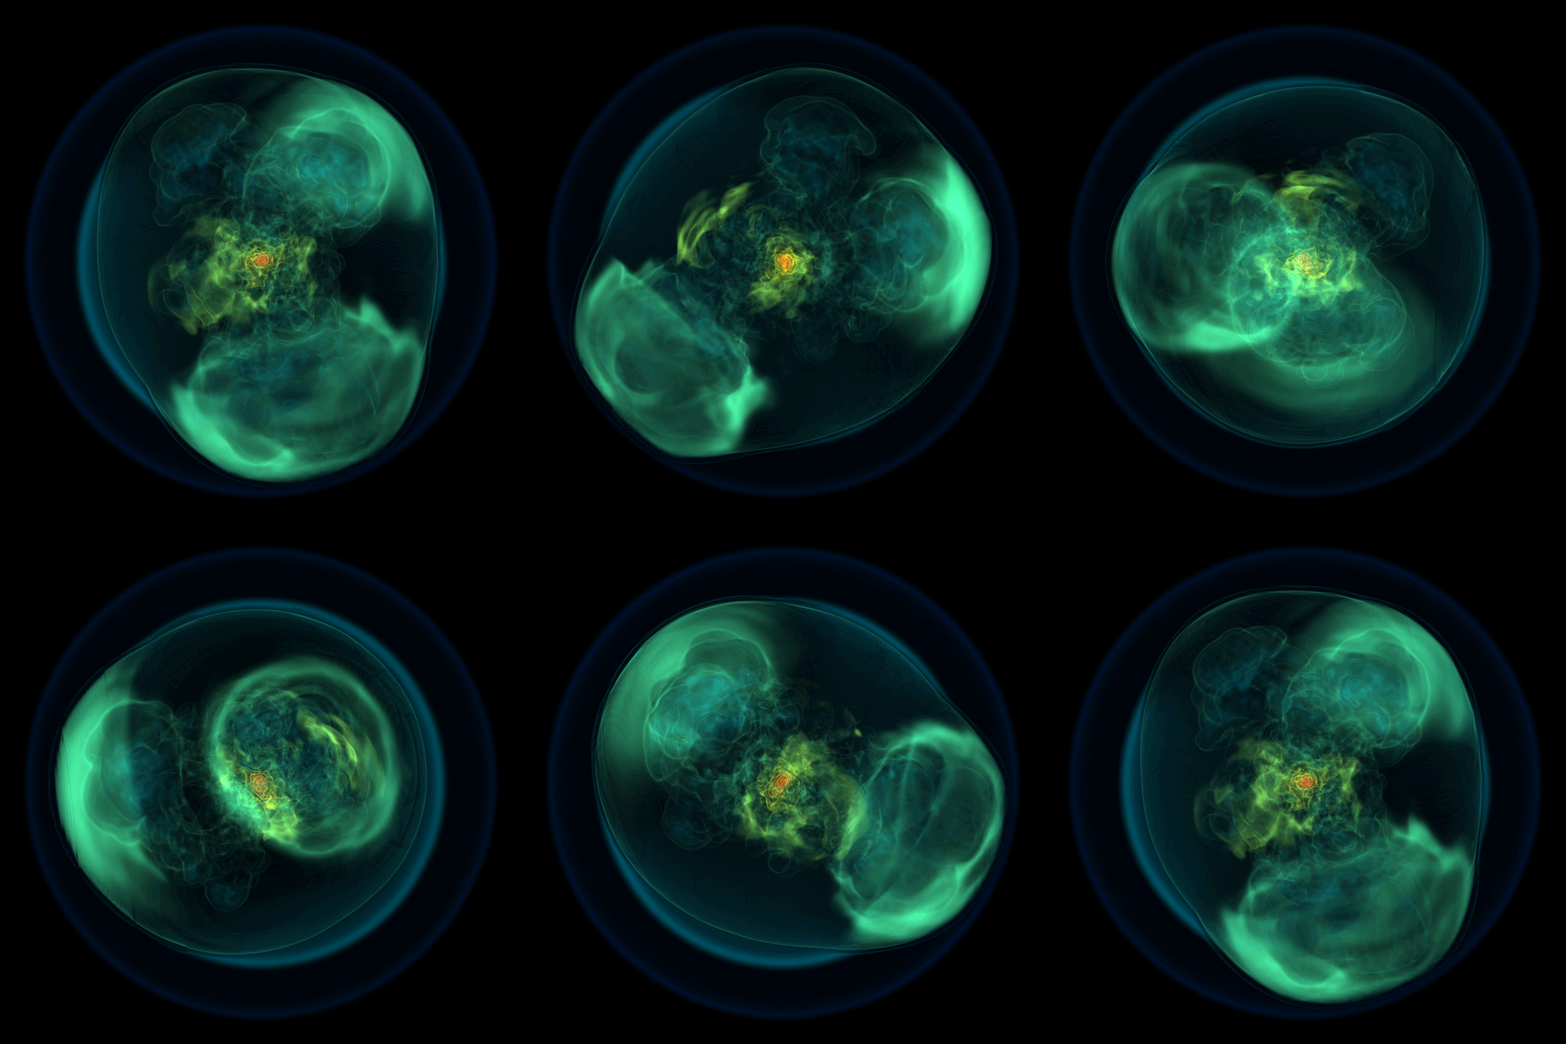
 Volume rendering of the gas density around an exploding star. Color and opacity show the density from high (red/opaque) to low (blue/transparent).
Context
When massive stars approach the end of their lives, they explode violently as supernovae. These cosmic explosions are the results of many inter-dependent physical processes: nuclear fusion and neutrino transport at the cores of the stars, convective and supersonic gas flows, all in the presence of strong gravity and turbulence.
In order to realize these explosions in simulations, scientists rely on a handful of physics solvers each responsible for a subset of physics relevant to a certain stage of explosion. However, there is no existing end-to-end pipeline for the process – scientists have to manually traverse the software stack; each layer of the stack often requires days to learn and a PhD to master.
Objective
Joining forces with a few researchers who are masters of various layers of the software stack, we set out to construct an end-to-end simulation pipeline capable of evolving stars from their births all the way to their explosive ends. The pipeline should evolve the simulations with minimal human inputs, while providing useful analysis/diagnostic metrics and visualization products.
Approach
We employ a few tricks to allow the simulations of stars across large spatial and temporal scales.
First, we use a 3D spherical voxel grid with logarithmic radial grid spacing. Stars are mostly spheres, so a spherical grid naturally fits the geometry of our problem. The logarithmic grid allocates finer spatial resolution at small radius, allowing the simulations to retain the important small-scale details at the beginning of the stellar explosions. As the exploding stars expand, we care much less near the explosion centers and the coarser grid spacing at large radii suffices.
Second, we design our pipeline to adaptively allocate and deallocate voxel grids depending on the stage of the simulation. In the beginning of a stellar explosion, we do not need to keep all the far-away voxels in memory. And similarly, long after the explosion took its course, we do not really care about the void it left behind.
Third, many of the components in our physics solvers are trivially parallelizable. We massively parallelize the calculations by offloading them to the GPUs in large batches. For example, the hydrodynamics of a voxel cell cares only about its neighbors; voxels cells are accelerated by the same gravity field; and the equation of state (EoS) update is strictly a local operation.
Results
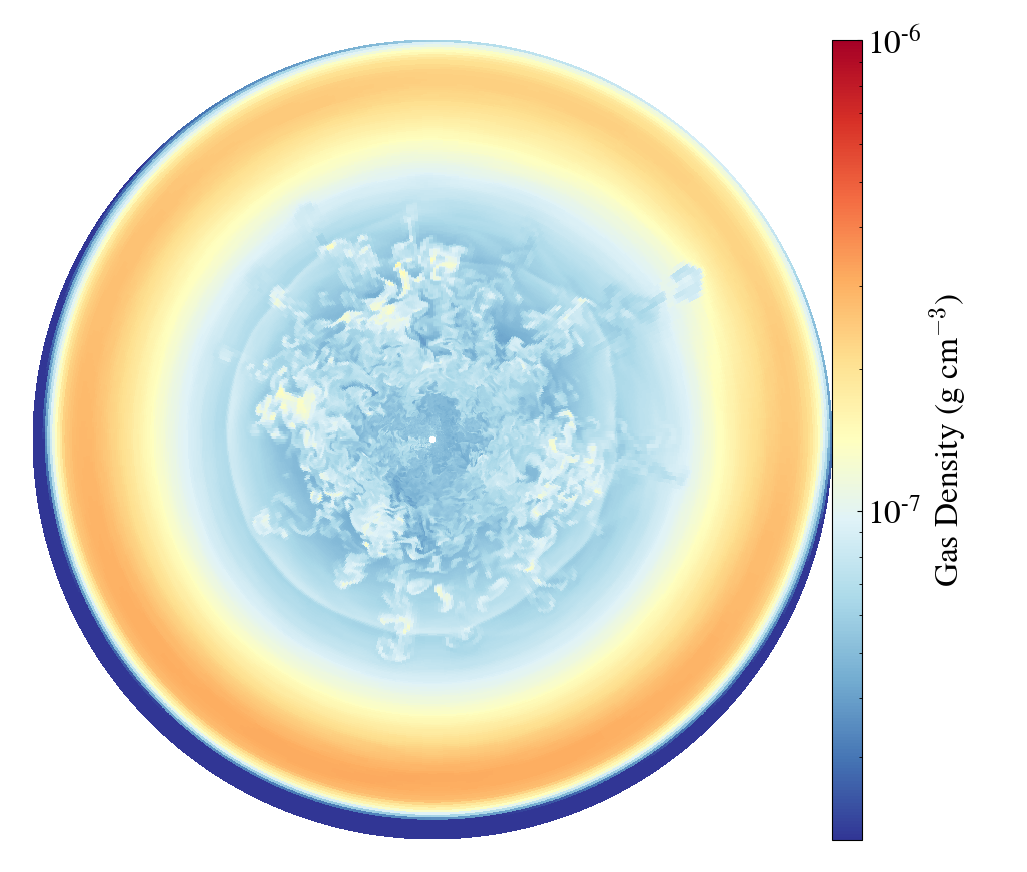
The volume rendering above shows a star a few seconds after the explosion started. With the new simulation pipeline, we can now advance the simulations much longer than we used to. Below is a slice plot showing the mid-plane density distribution of the star two days after the explosion.

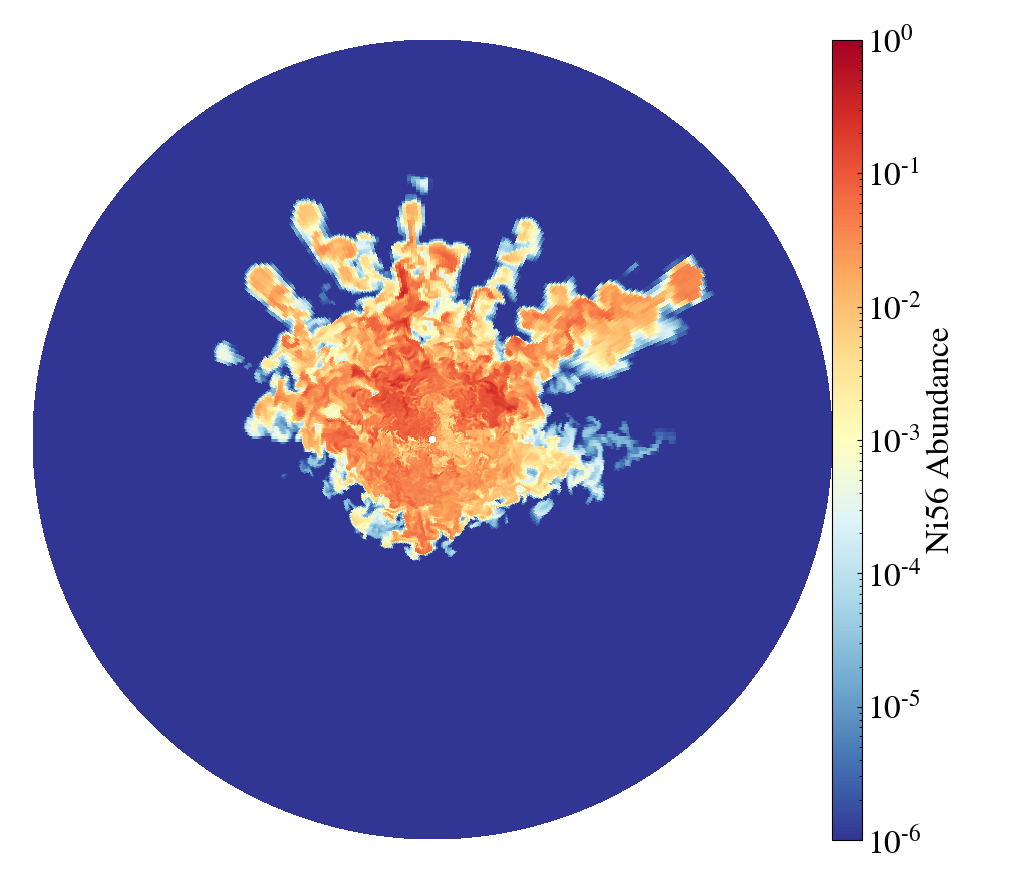
Thanks to the logarithmic voxel grids, we are able to track the evolution of the intricate finger-like structures. The plot below shows the same region, now displaying the distribution of nickel, an essential chemical element produced in exploding stars.

Our software pipeline enables researchers to simulate stars across much larger spatial and temporal scales, previously unattainable due to technical difficulties. During the development, we also further optimized the GPU offloading strategy to allow asynchronous data transfer and compute, leading to a ~2x overall speedup.
This simulation software development project was awarded a total of 1+ million node-hours on a few leadership-class supercomputers including Frontera and Perlmutter. We have deployed our simulation pipeline on all of these platforms, enabling researchers to conduct their own exploding star simulations.
What’s Next?
We are now in the position to simulate stars not on one-by-one basis, but in populations. Like the simulation tools themselves, most existing analysis and visualization tools require a lot of manual tinkering to work well. We are now exploring different approaches to streamline the analysis/visualization pipeline, including interactive graphics and physics engines such as Unreal Engine.